Use Case
For traders who watch volume alongside price, especially to confirm real breakouts and filter out low-volume fakeouts.
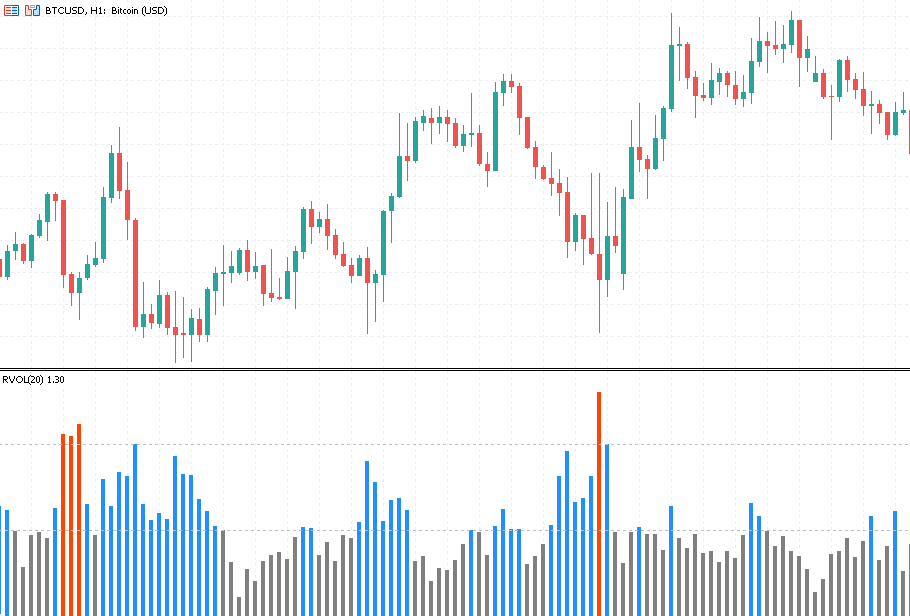
Relative Volume (RVOL) compares the current bar's volume against its historical average, then draws a single colored bar that tells you whether trading activity right now is heavy or light.
It sits in its own sub-window so it never covers your price chart. A high RVOL means more money is moving than usual, which often lines up with institutional entries, the start of a breakout, or a news-driven move. Use it to check whether a breakout actually has volume behind it, or to skip the quiet signals that tend to fake out.
What it shows you
- Whether current volume is above or below the historical average (RVOL above 1 means elevated volume)
- Three colors at a glance: gray for low, blue for normal, red for an unusual spike
- An RVOL above 2 usually points to institutional-sized activity
How to use it
- Pair it with breakouts: a breakout backed by volume is more trustworthy
- Be cautious on signals during low-volume periods, they fake out more often
- Adjust the spike threshold yourself to fit each instrument's volume habits
Free
Already have an account?
Platform
MT5
Last Update
Jul 2026
Features
- Color-coded bars show relative volume at a glance, gray/blue/red for low/normal/spike
- An RVOL above 2 flags institutional-sized volume spikes
- Custom spike threshold, shown in its own sub-window so it won't cover your chart
Need Custom Features?
Extend this EA with custom functionality or strategy adjustments