Use Case
For trend traders who want a quick read on whether price is rising, falling, or going nowhere, and how much push the trend still has. In choppy markets it also flags when to stay out.
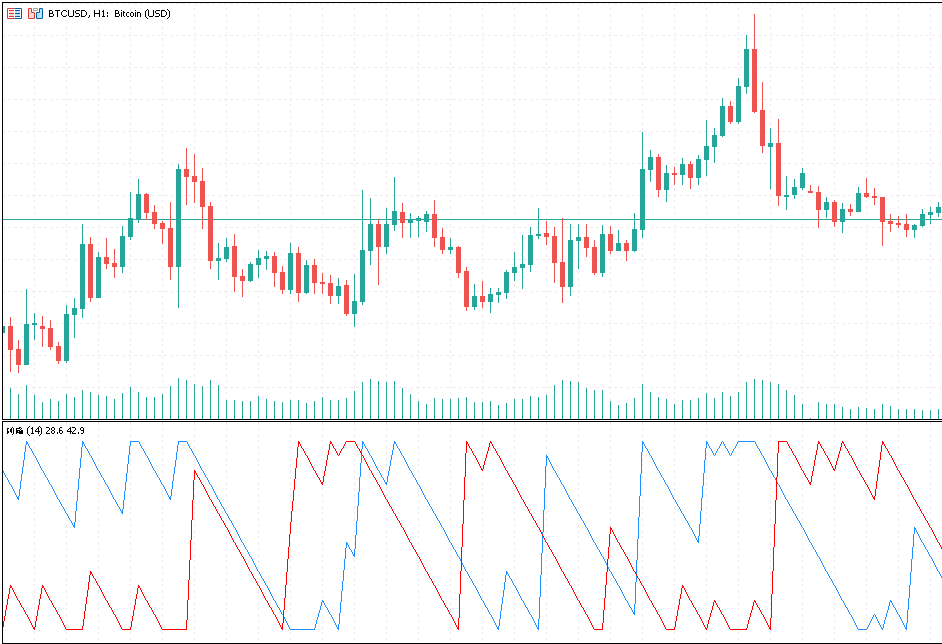
The Aroon Up & Down indicator plots two lines in a separate window so you can tell at a glance whether price is trending up, trending down, or just drifting sideways, and whether that trend still has any push left.
The idea behind it is plain: it keeps track of how recently the highest high and the lowest low showed up over a lookback window. A fresh high means upward momentum is young, so the blue line sits high; a fresh low means sellers are in charge, so the red line sits high. Whichever line is on top tells you which way the bias leans.
What it helps you see
- Blue above red means bulls are in control; flip it and bears have the upper hand
- The moment the two lines cross is often the early hint that the trend is about to turn
- When both lines hug the bottom and tangle, it usually means a flat, range-bound market where you should stay out
How to use it
- Treat blue crossing above red as a long cue and red crossing above blue as a short cue, paired with your own entry rules
- Switch on the email or pop-up alert so a cross pings you instead of having to watch the chart all day
- It does not place trades itself; it is a read on direction and momentum to support your own decisions
Free
Already have an account?
Platform
MT5
Last Update
Oct 2026
Features
- Two lines show trend direction at a glance: whichever is on top is the bias
- Line crossings flag a possible trend turn; both lines tangling low warns of a flat market to avoid
- Optional email or pop-up alert fires on a cross so you don't have to watch the chart
Need Custom Features?
Extend this EA with custom functionality or strategy adjustments