Use Case
For traders who read overbought and oversold conditions through channels, it shows how far price has drifted from its center in both trends and ranges, helping you spot spots to fade or follow.
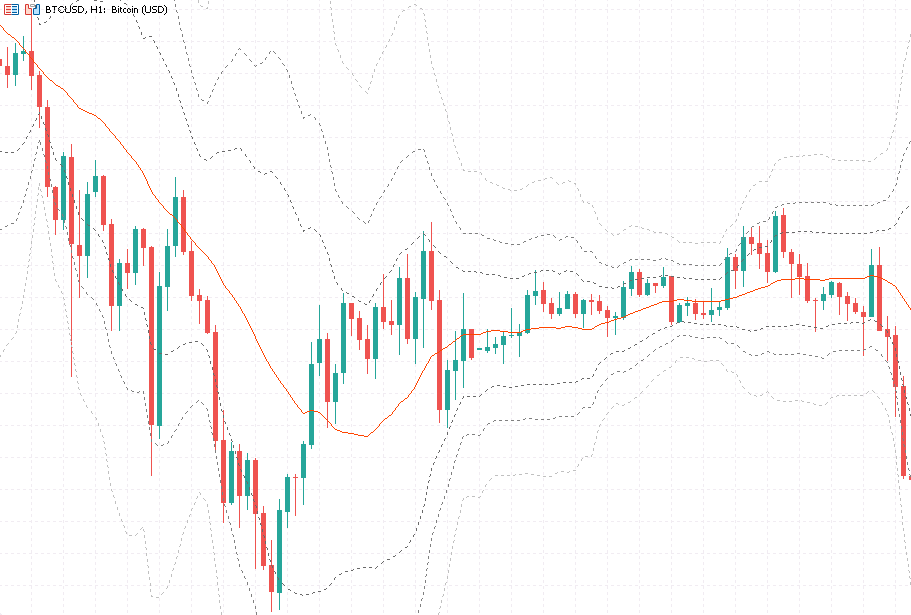
The Bollinger Bands Fibonacci Channel indicator replaces the standard deviation multiplier in a classic Bollinger Band with Fibonacci ratios. It draws a center line plus three channel layers on each side, right on your main chart, so you can read at a glance how far price has wandered from its normal range.
The center line is a moving average that tracks recent price balance. The six outer lines fan out using three rising Fibonacci ratios, splitting the move into layers that run from hugging the center to shooting well past it. The deeper into the outer layers price travels, the more stretched the move is, and the higher the odds of a pullback or reversal. You can pick from several moving average types and switch to a Heikin Ashi price source for a smoother channel in choppy conditions.
What it shows you
- Which layer price currently sits in, from near the center line to pressing against the outermost band
- Whether the market is in a tight range or a trending stretch with the channel opening up
- How price reacts after touching an outer band, as a cue for mean reversion or trend continuation
How to use it
- Overlay it on your main chart and read price location alongside your own entry signals
- Pay closer attention when price tags an outer band, then decide whether to fade or follow based on the move
- Use the Heikin Ashi price source for a smoother channel, or standard close for a tighter fit to live price
Choose how to buy
✦Membership accessBest value
Plus members can use all in-house products during the subscription period.
from $19/mo
✓One-time license
For this tool only. Buy once and keep permanent access.
$30
7-day money-back · Instant download
Platform
MT5
Last Update
Oct 2026
Features
- Fibonacci ratios replace the standard deviation multiplier, with three channel layers on each side to grade how far price has stretched
- Several moving average types let the center line fit different trading styles
- Switch to a Heikin Ashi price source for a smoother channel in choppy markets
Need Custom Features?
Extend this EA with custom functionality or strategy adjustments