Use Case
Built for mean-reversion traders, helping you catch price snapping back after stretching too far from its mean in ranging markets.
The Statistical Oscillator uses the Z-Score to measure how many standard deviations the current price has moved away from its mean, giving you a statistical read on whether price has reached an extreme. The larger the Z-Score, the further price sits from its average.
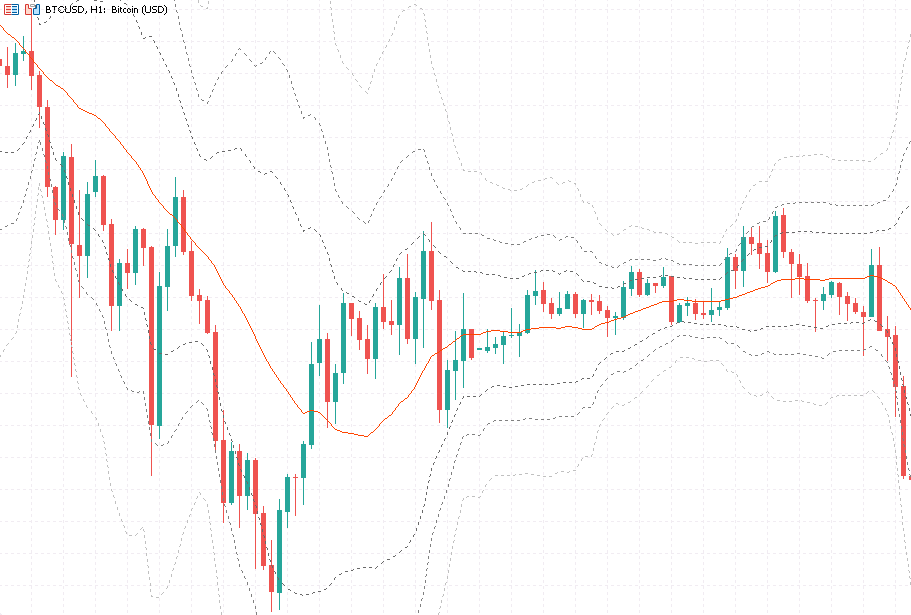
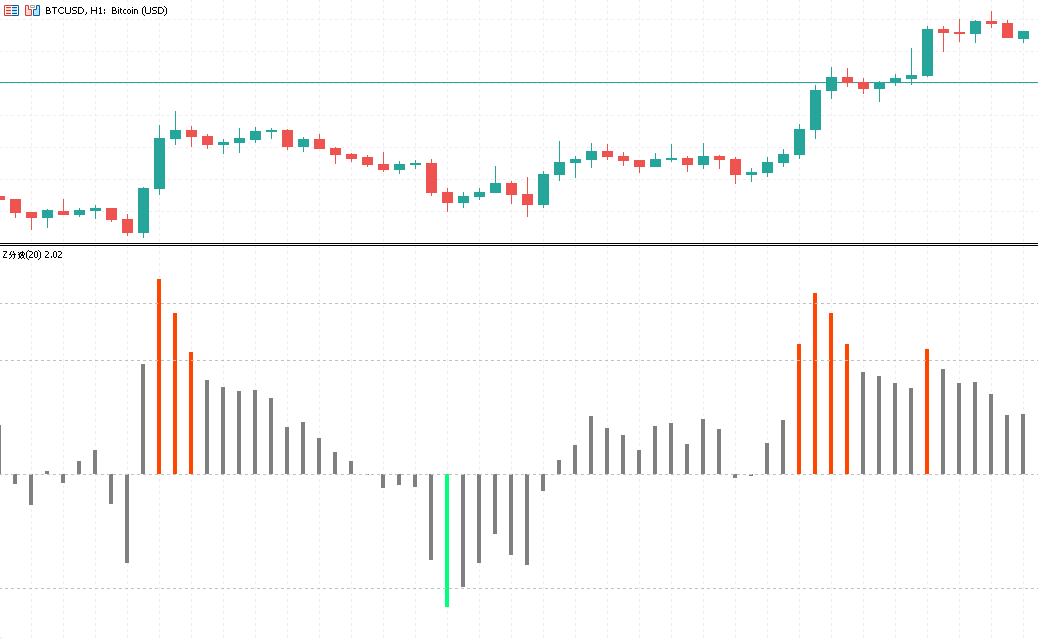
The idea is to view price movement through a normal distribution: when price stretches beyond 2 standard deviations, it only lands there roughly 5% of the time, which often points to a pull back toward the mean. The indicator plots the Z-Score as a histogram with ±2σ and ±3σ reference lines, so overbought and oversold zones are easy to spot.
What it shows you
- How far price has drifted from its mean, and whether that move is normal or statistically extreme
- Grey marks the normal range, orange-red flags overbought, green flags oversold
- A touch of ±3σ means a more extreme stretch with a higher chance of reverting
How to use it
- Built for mean-reversion traders looking for fades at extreme readings
- The lookback period is adjustable: shorter reacts faster, longer stays steadier
- Pick your price source from close, open, high and others to match your style
Choose how to buy
✦Membership accessBest value
Plus members can use all in-house products during the subscription period.
from $19/mo
✓One-time license
For this tool only. Buy once and keep permanent access.
$30
7-day money-back · Instant download
Platform
MT5
Last Update
Aug 2026
Features
- Z-Score measures how far price has drifted from its mean in standard deviations to flag statistical extremes
- Three-color histogram with ±2σ / ±3σ reference lines makes overbought and oversold instantly readable
- Adjustable lookback period and price source adapt to different instruments and trading styles
Need Custom Features?
Extend this EA with custom functionality or strategy adjustments