Use Case
For traders who want to read market structure and trade distribution before deciding, especially useful for gauging support and resistance, telling balance from trend, and spotting where price tends to revert.
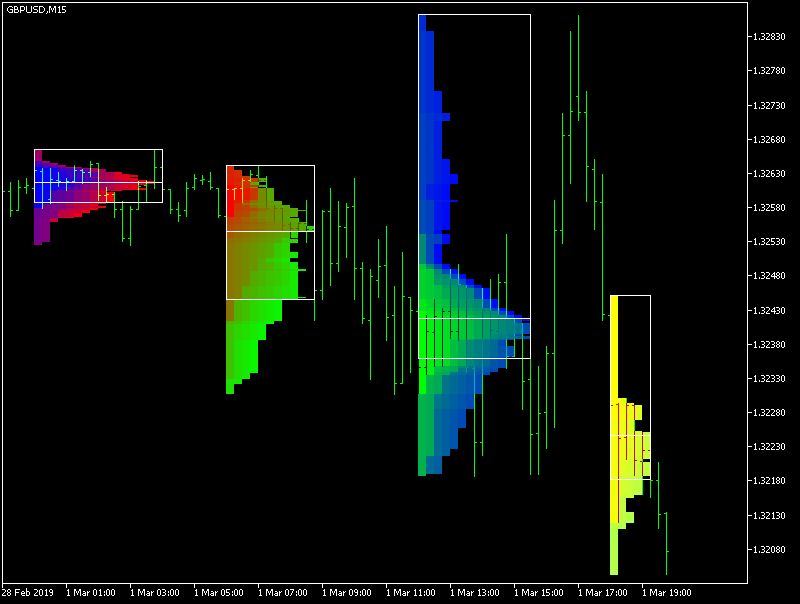
The Market Profile indicator turns how long price spends at each level during a session into a horizontal TPO histogram, so you can see at a glance where the market spent most of its time. It doesn't fire buy or sell signals, it's a visual tool for reading market structure.
The idea is to answer one question: where is the price everyone treats as fair, and where did the market get quickly rejected. It works out the value area (VAH, VAL) and the point of control (POC) for you, then adds the median, single prints and the other classic profile elements to tell the story of a period's trading distribution.
What It Helps You See
- Value area high and low (VAH/VAL) plus the POC, to pin down support, resistance and reversion targets
- Balance versus trend: whether the distribution is narrow and clustered or stretched into a line, structure made obvious
- Single prints and gap zones, flagging thin levels where price ran through with little trade
How To Use It
- Pick a session of intraday, day, week, month, quarter, half-year or year, or draw a rectangle for any custom range
- Developing POC and developing value area evolve in real time, so you can track where the center is shifting during the session
- Price breaks, candle-close crossovers and gap crossovers can trigger pop-up, email or mobile push alerts
Choose how to buy
✦Membership accessBest value
Plus members can use all in-house products during the subscription period.
from $19/mo
✓One-time license
For this tool only. Buy once and keep permanent access.
$45
7-day money-back · Instant download
Platform
MT5
Last Update
Oct 2026
Features
- Automatically calculates and marks the value area (VAH/VAL) and the POC
- Sessions from intraday to yearly, plus a rectangle tool for any custom range
- Developing POC and value area evolve live during the session, with price-crossover alerts
Need Custom Features?
Extend this EA with custom functionality or strategy adjustments