Use Case
For traders who want to know at a glance how much the current symbol is up or down today versus yesterday, parked in the chart corner.
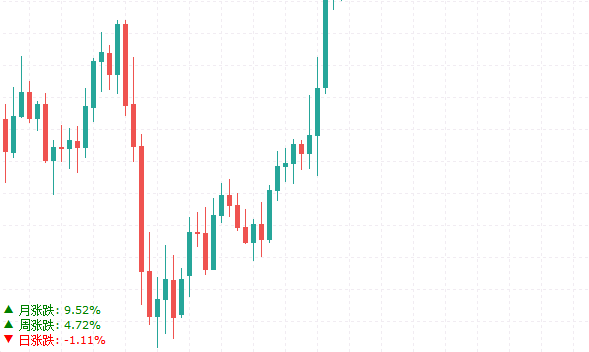
This indicator shows the current symbol's price change right in the chart corner. It takes yesterday's close as the baseline, works out the percentage move to the current bid, and marks the direction with color and an arrow, so one glance tells you whether the day is up or down and by how much. Beyond the daily change, it can also display weekly and monthly change so you can read strength across different time spans.
Brokers run on different server times, so the cutoff for "yesterday" can be off by a few hours. The indicator has a timezone offset setting; adjust it to line up with your account's day boundary and the percentages come out right.
What it shows you
- How much the current symbol is up or down today, with a clear direction
- Weekly and monthly change to gauge medium-term strength
- An easy way to compare several symbols side by side
How to use it
- Set the timezone offset to match your broker so the day boundary is correct
- Position, color, font and arrow style are all adjustable, tuck it in a corner that doesn't cover price
- Works on any symbol and stays light on MT5
Choose how to buy
✦Membership accessBest value
Plus members can use all in-house products during the subscription period.
from $19/mo
✓One-time license
For this tool only. Buy once and keep permanent access.
$30
7-day money-back · Instant download
Platform
MT5
Last Update
Oct 2026
Features
- Real-time daily change off yesterday's close, with color and arrow for direction
- Optional weekly and monthly change to read strength across time spans
- Timezone offset aligns the day boundary with your broker for accurate percentages
Need Custom Features?
Extend this EA with custom functionality or strategy adjustments