Use Case
Built for traders who make decisions off support and resistance, especially those who watch ranges, pivots, and overbought/oversold levels. It helps you spot entry and exit zones in both ranging and trending markets.
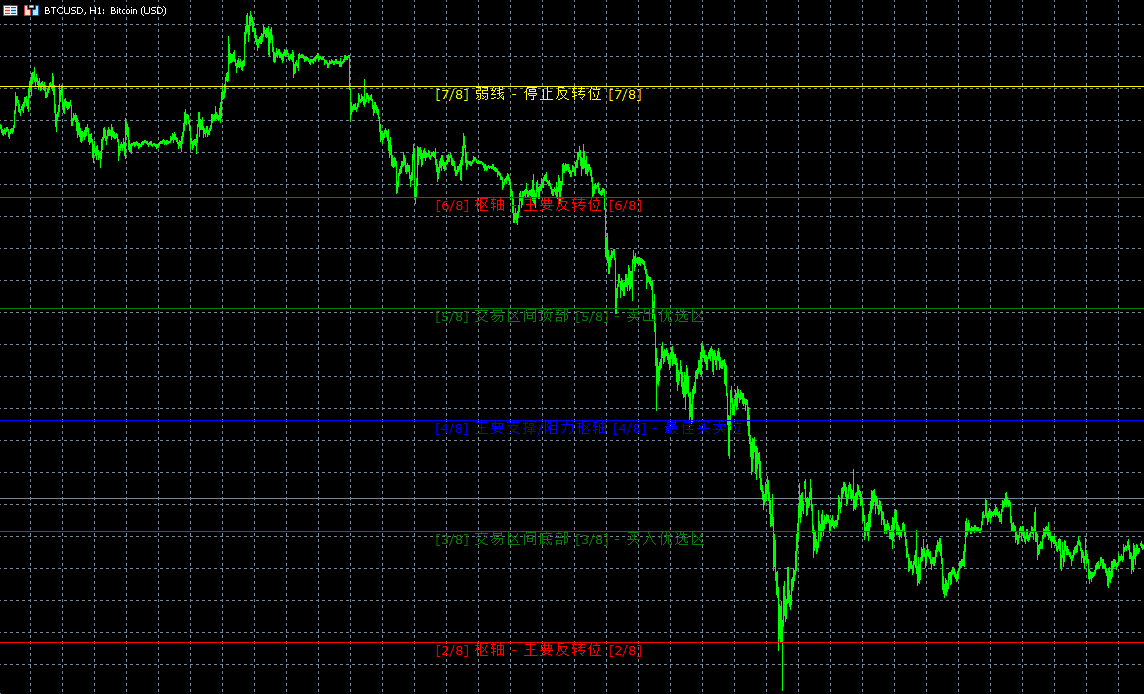
The Murrey Math Line support and resistance indicator automatically draws a set of horizontal price levels, split using the eighths method, so you can see ahead of time where price is likely to stall or reverse.
The idea comes from Murrey Math rules: it takes the current trading range and divides it into eighths, where each line marks a meaningful level in the market structure. As price moves between these lines, some act as strong support and resistance, some as reversal pivots, and others mark the overbought and oversold extremes. It works across timeframes.
What it shows you
- A set of eighth lines marking the key support and resistance levels inside the current range
- A clear separation between major pivots, reversal lines, and the overbought/oversold extremes, with each level's meaning written on its label
- Where the good buy and sell zones sit and where price tends to get stuck, visible the moment you open the chart
How to use it
- You can point it at a higher timeframe to build the range, so a lower timeframe chart can still reflect the bigger structure
- When price breaks any line, you get pop-up, email, and mobile push alerts, so you don't have to watch the screen all day
- Labels can sit on the left or right of the chart, and line colors and widths are all adjustable
Choose how to buy
✦Membership accessBest value
Plus members can use all in-house products during the subscription period.
from $19/mo
✓One-time license
For this tool only. Buy once and keep permanent access.
$30
7-day money-back · Instant download
Platform
MT5
Last Update
Aug 2026
Features
- Automatically draws the full set of Murrey Math eighth lines, with each key level's meaning labeled right on the chart
- Separates major pivots, reversal lines, and overbought/oversold extremes, so you can see good buy/sell zones and likely reversal points
- Can build its range from a higher timeframe, with pop-up, email, and mobile push alerts on any line break
Need Custom Features?
Extend this EA with custom functionality or strategy adjustments