Use Case
Groups bullish and bearish fair value gaps by price level, then uses a profile and rolling POC to reveal where historical imbalances are most concentrated.
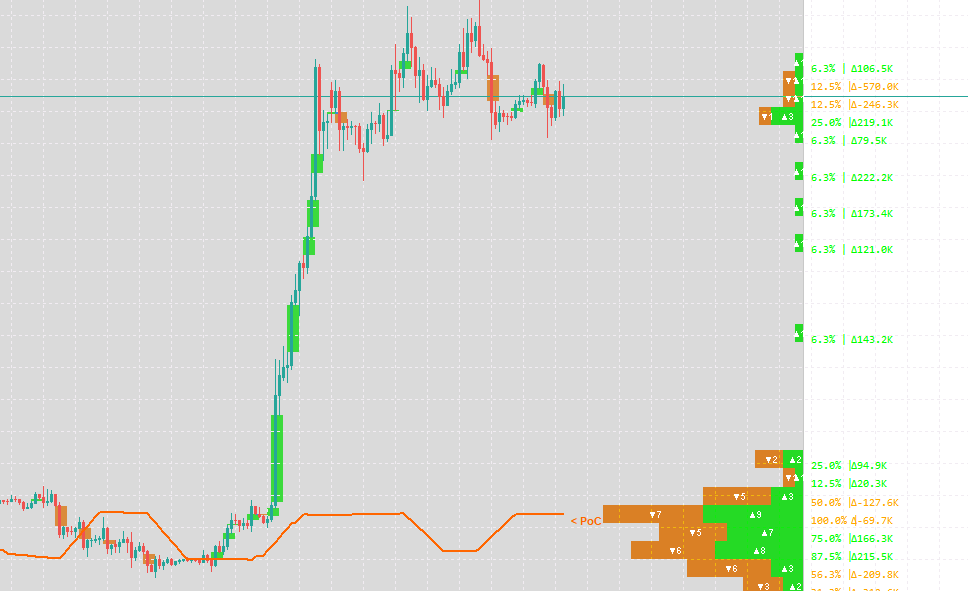
FVG Profile & POC converts fair value gap structure into a price-level distribution. It detects bullish and bearish FVGs within the lookback window, groups them by the midpoint of each gap, and draws a two-sided horizontal profile. Each price row can show gap counts, relative strength, and the difference in associated tick volume. A rolling POC tracks the price level with the highest FVG concentration as the market evolves.
How to Read It
- Bullish and bearish profile bars show the number of each FVG type found at a price level; longer bars indicate a denser concentration.
- The percentage compares a row with the overall profile, while Delta shows the difference between tick volume associated with bullish and bearish gaps.
- The POC line follows the most active FVG price row in the rolling window and provides context for where imbalance structure has clustered.
Typical Uses
- Locate price areas with concentrated historical imbalance.
- Compare bullish and bearish FVG density and tick-volume differences across price levels.
- Combine gap zones, the optional heatmap, and rolling POC when assessing potential reaction areas. The indicator does not place or manage trades.
Choose how to buy
✦Membership accessBest value
Pro members can use all products during the subscription period.
from $59/mo
✓One-time license
For this tool only. Buy once and keep permanent access.
$45
7-day money-back · Instant download
Platform
MT5
Last Update
Sep 2026
Features
- Bullish and bearish FVG density grouped by price level
- Rolling POC for the most concentrated FVG price row
- Per-level strength, gap counts, and tick-volume delta
- Optional gap zones, profile display, and heatmap overlay
Need Custom Features?
Contact the author for custom functionality or strategy adjustments