Use Case
Auto-detect divergences across 5 oscillators with dual-chart line marking
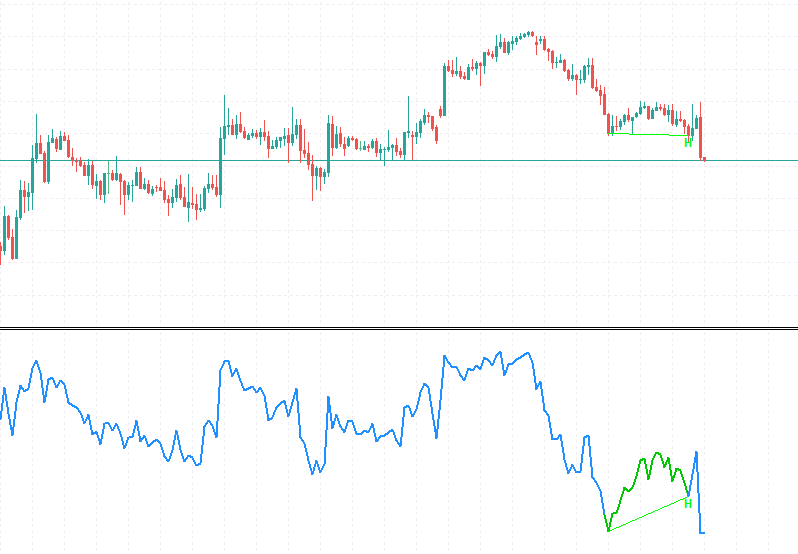
Automatically detects divergences between price and oscillator using zigzag pivot analysis. Supports 5 oscillators (RSI, CCI, MFI, ROC, Williams %R) and 4 divergence types, with lines drawn simultaneously on both the oscillator subwindow and the main price chart.
The indicator runs a zigzag algorithm on the oscillator to identify pivot highs and lows, then compares them against the corresponding price pivots. When price makes a new high but the oscillator does not follow (or vice versa), a divergence is detected. Four types are supported: regular bullish (price lower low + oscillator higher low), regular bearish (price higher high + oscillator lower high), hidden bullish (trend continuation), and hidden bearish (trend continuation). Each type can be toggled independently.
Every detected divergence draws lines in two places simultaneously: one connecting oscillator pivots in the subwindow, and one connecting the corresponding price pivots on the main chart. Labels show D for regular divergences and H for hidden ones. Green = bullish, red = bearish.
The indicator also detects tentative (unconfirmed) divergences forming in real time, shown as dashed lines. These may disappear as new bars form but provide early warning of potential setups. Confirmed divergences use solid lines and remain on the chart.
The oscillator line automatically changes color in divergence zones (green/red) for quick visual identification.
Available in both Chinese and English versions.
Applicable instruments: All forex pairs, metals, crypto, and indices supported by MT5 Applicable timeframe: M15 through D1
Choose how to buy
✦Membership accessBest value
Plus members can use all in-house products during the subscription period.
from $19/mo
✓One-time license
For this tool only. Buy once and keep permanent access.
$100
7-day money-back · Instant download
Platform
MT5
Last Update
Sep 2026
Features
- 5 oscillators + 4 divergence types — auto-detected, no manual comparison
- Dual-chart lines on both oscillator and price chart
- Real-time tentative divergence detection with dashed early warning
Need Custom Features?
Extend this EA with custom functionality or strategy adjustments