Use Case
Color-graded SMA + ATR deviation bands + trend distribution profile
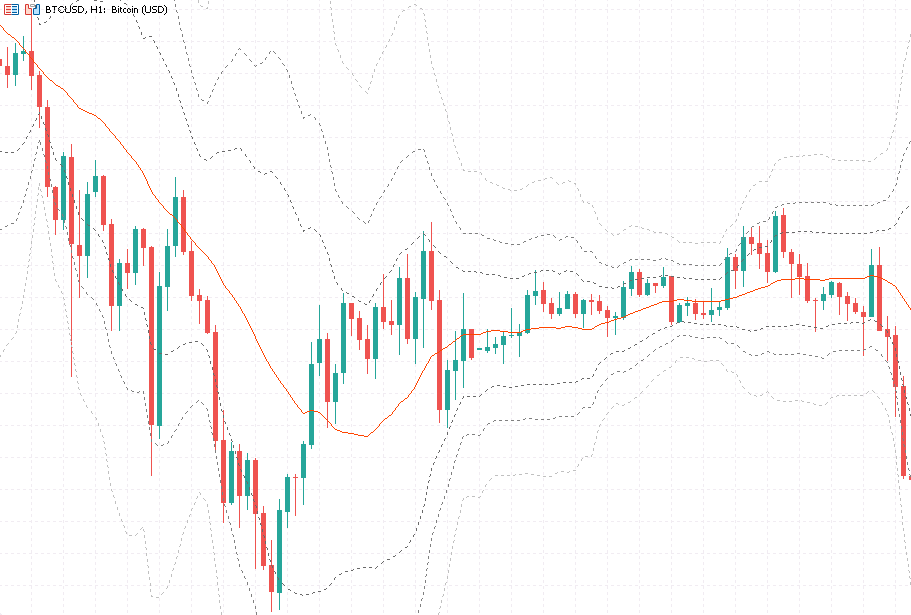
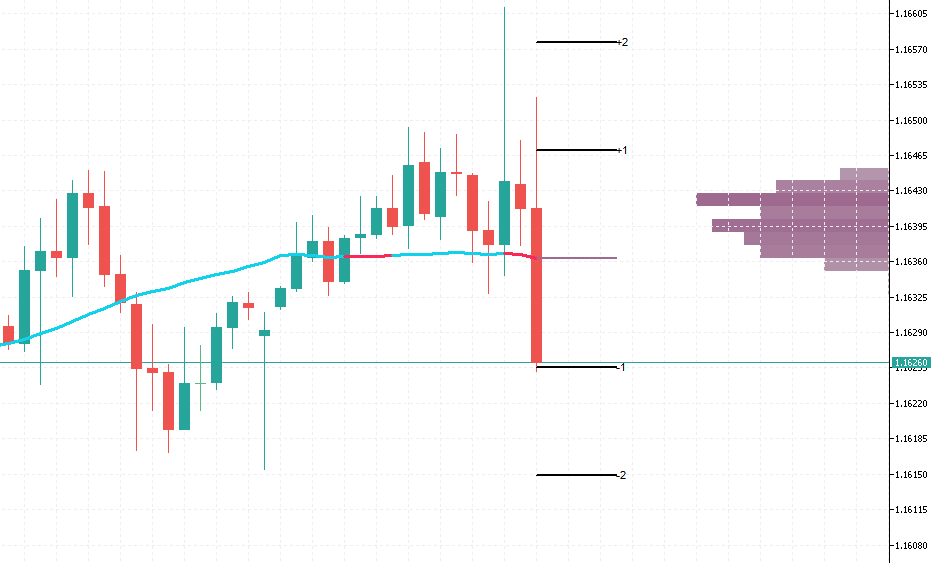
Color-graded SMA that shifts between bull and bear colors based on trend momentum, with ATR standard deviation bands and a distribution profile. See trend direction, strength, and how far price has deviated from the mean in one glance.
The SMA line is not a simple single-color average. The indicator measures how fast the SMA changed over the last 5 bars, normalizes that speed against a 500-bar percentile window, and maps the result to a color gradient. Positive momentum shows the bull color (cyan), negative shows the bear color (pink). Stronger momentum means more vivid color. When the normalized value crosses the zero threshold, a dot appears on the SMA marking a trend reversal.
Deviation bands are calculated from ATR(200), extending 3 standard deviation levels above and below the SMA (+1/+2/+3 and -1/-2/-3). These levels are not static. They automatically widen on volatile instruments and tighten on calm ones. Price between +/-1 is normal range, +/-2 is significant deviation, +/-3 is extreme. The deviation lines serve as mean-reversion references when price stretches too far from the average.
The distribution profile counts how many bars price spent at each deviation level since the last trend reversal, drawn as a gradient bar chart on the right side of the chart. Longer bars mean more time at that level. The profile color matches the current trend direction and resets automatically on each reversal.
Available in both Chinese and English versions.
Applicable instruments: All forex pairs, metals, crypto, and indices supported by MT5 Applicable timeframe: M15 through D1
Choose how to buy
✦Membership accessBest value
Plus members can use all in-house products during the subscription period.
from $19/mo
✓One-time license
For this tool only. Buy once and keep permanent access.
$30
7-day money-back · Instant download
Platform
MT5
Last Update
Aug 2026
Features
- SMA changes color with trend momentum, dots mark reversals
- +/-1/2/3 ATR deviation bands auto-adapt to volatility
- Distribution profile shows time spent at each deviation level
Need Custom Features?
Extend this EA with custom functionality or strategy adjustments