Use Case
Delta gradient volume profile — see net buying vs selling pressure at every price level
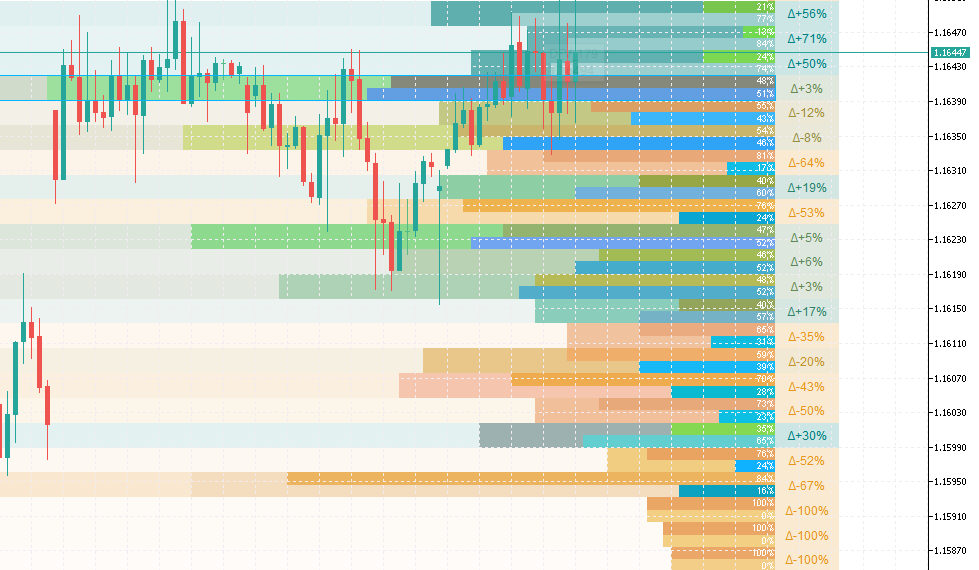
Draws a volume profile on the right side of the chart that splits each price level into bull and bear volume, with gradient coloring to show the Delta at every level. See at a glance which prices have net buying pressure and which have net selling pressure.
Each row in the profile represents a price bin. Colors gradient from bear (orange) to bull (teal). The more teal a row is, the stronger the buying pressure at that level. Each row is further split into two halves: top half shows bear volume, bottom half shows bull volume, with percentage labels beside each. This gives you not just the total volume but the exact bull/bear ratio at every price.
The Delta label column on the right edge shows the net difference as a percentage. Positive values like +26% mean buyers dominated, negative values like -15% mean sellers did. Colors match the profile gradient so you can scan the whole column in seconds.
The heatmap feature overlays semi-transparent color blocks on the historical candle area, using the same Delta gradient. With it enabled you can see activity hotspots and directional bias directly on the price action without scrolling to the profile.
POC (Point of Control) highlights the highest-volume bin with a blue outline. This level typically acts as the strongest support or resistance.
All drawing happens in the background layer and never covers candlesticks. Recalculates once per new bar.
Available in both Chinese and English versions.
Applicable instruments: All forex pairs, metals, crypto, and indices supported by MT5 Applicable timeframe: M5 through D1
Choose how to buy
✦Membership accessBest value
Plus members can use all in-house products during the subscription period.
from $19/mo
✓One-time license
For this tool only. Buy once and keep permanent access.
$50
7-day money-back · Instant download
Platform
MT5
Last Update
Aug 2026
Features
- Volume split by bull/bear with Delta gradient — see net pressure at every price
- Heatmap overlays directly on candles for at-a-glance activity mapping
- POC highlight + bull/bear percentage labels per bin
Need Custom Features?
Extend this EA with custom functionality or strategy adjustments