Use Case
For traders who read support and resistance off VWAP levels, useful when you need to spot key price zones and watch how price reacts.
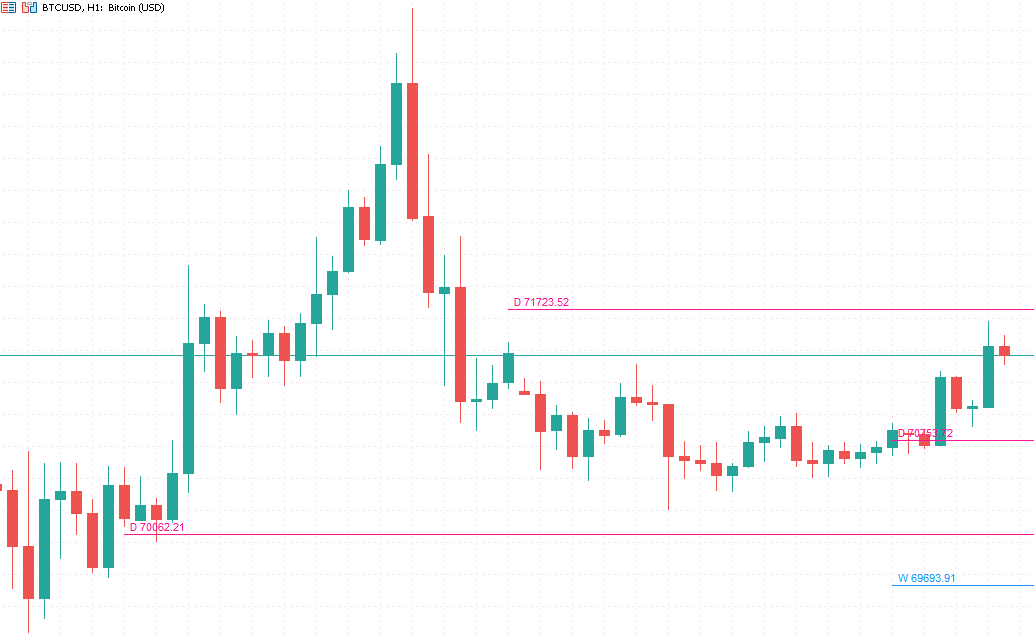
This is a VWAP horizontal-line indicator that draws on the main chart. It takes the historical daily, weekly, and monthly VWAP close prices and plots them as horizontal lines you can read as support and resistance.
The indicator calculates the VWAP close for all three timeframes, marks each one with its own color, and extends the line to the right toward current price. You can turn each level on or off independently, and cap how many recent lines each level keeps so the chart stays clean. When lines from different levels cluster around the same price, that zone tends to act as stronger support or resistance.
What It Shows You
- Key price levels from historical daily/weekly/monthly VWAP closes
- Zones where lines from several levels overlap, usually strong support or resistance
- How far current price sits from these reference lines
How to Use It
- Each level has its own color, so you can tell daily from weekly or monthly at a glance
- Set how many recent lines to keep and skip the clutter
- Every line is labeled with its price and timeframe, no counting needed
Choose how to buy
✦Membership accessBest value
Plus members can use all in-house products during the subscription period.
from $19/mo
✓One-time license
For this tool only. Buy once and keep permanent access.
$30
7-day money-back · Instant download
Platform
MT5
Last Update
Jul 2026
Features
- Plots daily/weekly/monthly VWAP historical close lines, each in its own color
- Each level toggles on or off, and you can cap how many recent lines it keeps
- Flags zones where multiple levels overlap as strong support/resistance, every line labeled with price and timeframe
Need Custom Features?
Extend this EA with custom functionality or strategy adjustments