Use Case
For traders who trade on momentum rhythm intraday or on swings: read CCI momentum direction and strength from a simple histogram, and use zero-line crossings to time entries and exits.
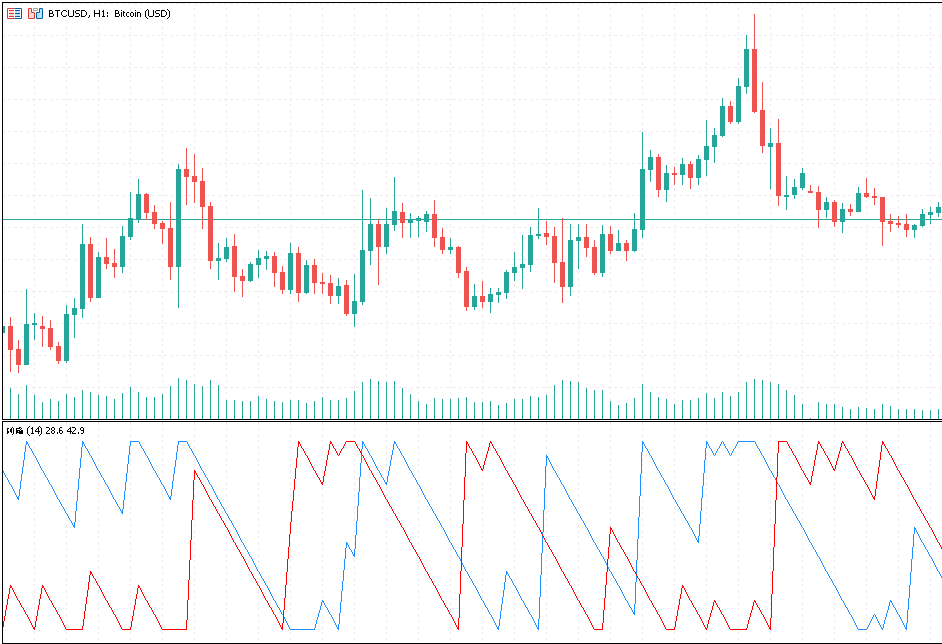
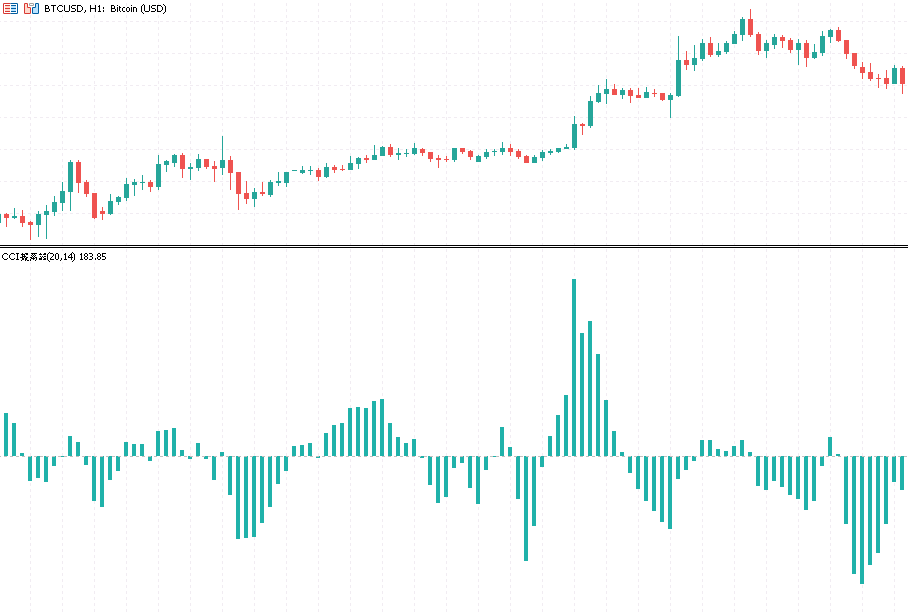
The CCI Oscillator plots the gap between CCI and its signal line (a moving average) as a histogram, so you can read momentum direction at a glance. When the bars flip above the zero line, CCI is sitting above its signal line and momentum is bullish; bars below the line mean bearish momentum.
It works much like a MACD built on CCI: bars crossing from negative to positive are a buy reference, and positive to negative a sell reference. Longer bars mean stronger momentum, and bars that start to shrink usually hint the current move is losing steam, giving you an early heads-up on a possible reversal. The indicator sits in its own sub-window and won't cover your main chart.
What it shows you
- Momentum direction: which side of the zero line the bars are on tells bull from bear instantly
- Momentum strength: bar length reflects the push behind the move; shrinking bars warn of fading trend
- Turning points: zero-line crossings mark reference points for entries and exits
How to use it
- Pick from 7 signal-line MA types (SMA / EMA / SMMA / LWMA / TMA / DEMA / TEMA) to match the smoothing you prefer
- Price source supports both standard candles and Heikin Ashi; switch to Heikin Ashi when you want smoother signals
- Treat the zero-line crossing as your main signal, then use bar length to judge whether momentum is still carrying
Free
Already have an account?
Platform
MT5
Last Update
Jul 2026
Features
- Histogram of the CCI-to-signal-line gap shows momentum direction and strength at a glance
- Zero-line crossings give buy and sell references, much like a MACD built on CCI
- 7 signal-line MA types, with both standard candles and Heikin Ashi as price sources
Need Custom Features?
Extend this EA with custom functionality or strategy adjustments