Use Case
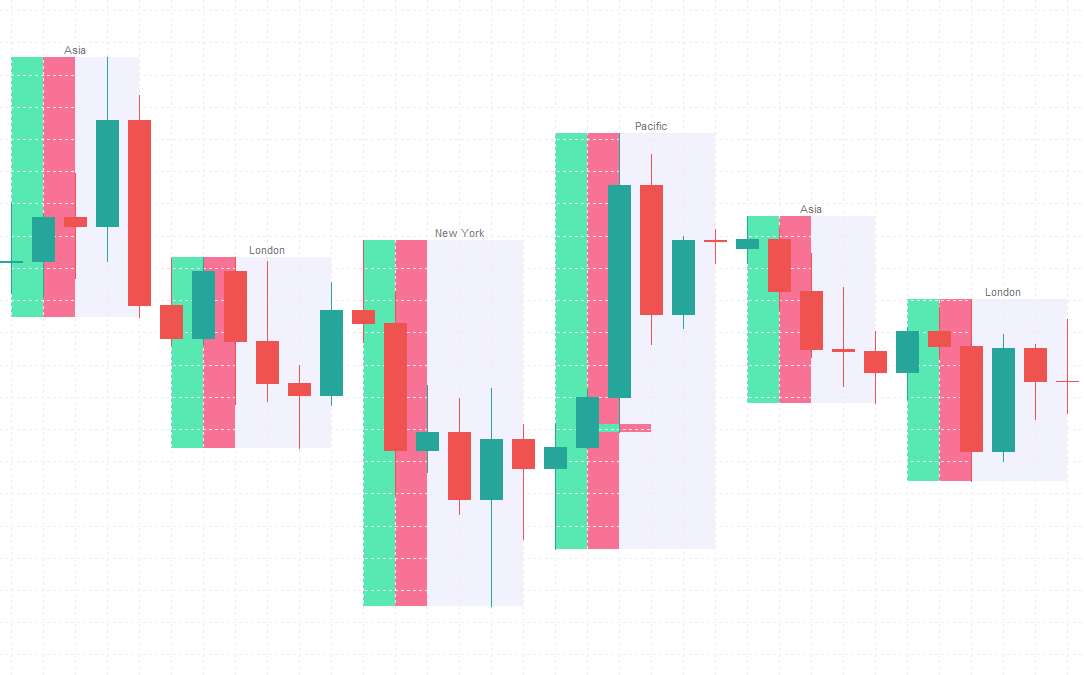
Dual-color session profiles showing bull vs bear volume at every price level
Splits each trading session into bull and bear volume and draws a dual-color profile showing where buying and selling pressure concentrated at each price level. See at a glance which side dominated and where the real battleground was.
The indicator divides the chart into 4 trading sessions, each with its own independent volume profile. Unlike traditional single-color Volume Profile, this one breaks down each candle's volume by direction: bullish candles count as buying volume, bearish candles count as selling volume. The result is a side-by-side red-green bar chart at each price level. Longer green bars mean more buying activity at that price, longer red bars mean more selling.
All 4 session time ranges are fully customizable. Defaults are 6-hour blocks (00:00-06:00 Asia, 06:00-12:00 London, 12:00-18:00 New York, 18:00-00:00 Pacific), but you can adjust them to match your broker's server timezone or disable sessions you do not need. Each session has its own bull and bear color settings.
Enable POC (Point of Control) to see a horizontal line at the highest-volume price in each session. This level typically acts as the session's strongest support or resistance. Price returning to a previous session's POC often triggers a reaction.
Session boxes draw rectangles around each time block with the session name displayed at the top (Asia, London, etc.), making it easy to identify which session is currently active.
All profile drawing happens in the chart's background layer and never covers candlesticks. Recalculates once per new bar with minimal CPU usage.
Available in both Chinese and English versions.
Applicable instruments: All forex pairs, metals, crypto, and indices supported by MT5 Applicable timeframe: M5 through H1 (daily+ makes session splits meaningless)
Choose how to buy
✦Membership accessBest value
Plus members can use all in-house products during the subscription period.
from $19/mo
✓One-time license
For this tool only. Buy once and keep permanent access.
$30
7-day money-back · Instant download
Platform
MT5
Last Update
Aug 2026
Features
- Bull/bear volume split per session — red/green profile shows who dominated
- 4 fully customizable sessions with adjustable times and colors
- POC line marks the highest-volume S/R level in each session
Need Custom Features?
Extend this EA with custom functionality or strategy adjustments