Use Case
Built for swing traders who watch volume momentum: use it when you want to know how much steam the current move has left, which retracement level price is sitting at, and roughly when the next turn might come.
Wave Fibonacci is a visual tool that pairs "float volume" with swing structure, so you can see how far the current move has run and how much momentum it has left.
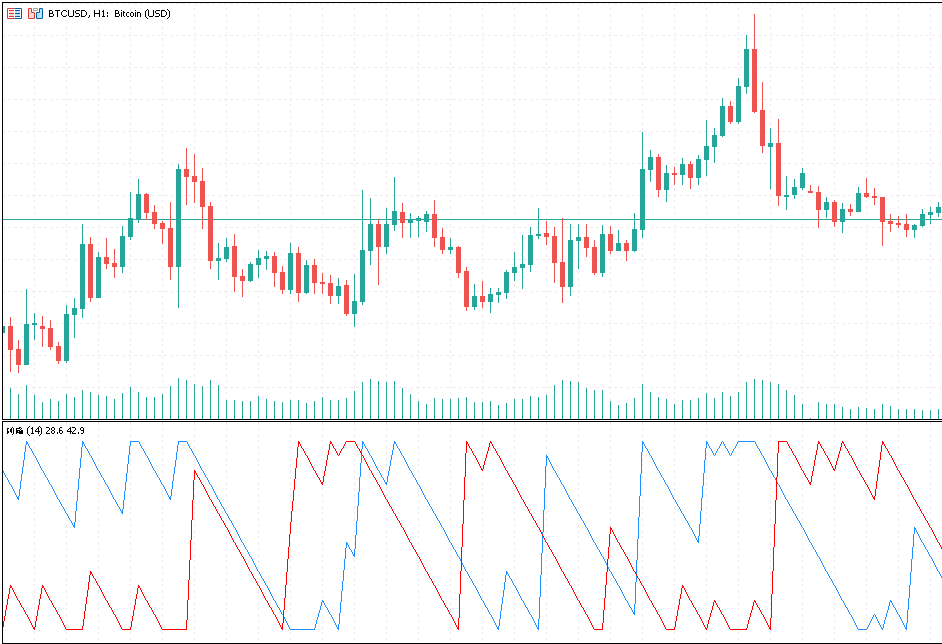
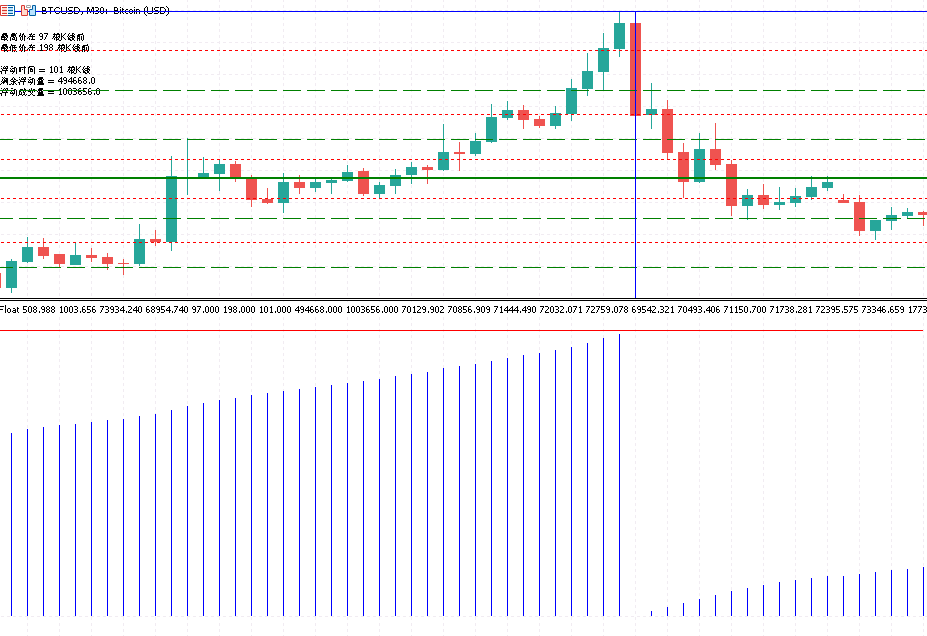
The idea comes from classic Float volume analysis: it finds the highest and lowest points within a recent stretch of price action, treats that as one complete swing, then accumulates the volume inside that range. The blue histogram in the sub-window shows how much volume has been traded so far, while the red line marks the total float volume for the swing. The closer the bars get to the red line, the more that move's momentum has been spent. On the main chart it also draws the swing's high and low boundaries, Fibonacci retracement lines, Dinapoli mid-levels, and a few projection lines spaced out by the swing's own duration.
What it shows you
- The current swing's high and low boundaries, plus where price sits across the Fibonacci and Dinapoli levels
- A signal that the move may be running out of steam as the volume bars approach the red line
- Projection lines based on past swing timing, marking time windows for a possible next turn
How to use it
- Read momentum in the sub-window and price levels on the main chart, then judge entries and exits with both
- Use the boundary lines and Fibonacci/Dinapoli levels as support and resistance references
- Fibonacci and Dinapoli levels can each be turned off on their own, so you keep only the set you actually watch
Choose how to buy
✦Membership accessBest value
Plus members can use all in-house products during the subscription period.
from $19/mo
✓One-time license
For this tool only. Buy once and keep permanent access.
$30
7-day money-back · Instant download
Platform
MT5
Last Update
Aug 2026
Features
- Float volume histogram showing how much of the current swing has been traded versus its total, with bars near the red line flagging fading momentum
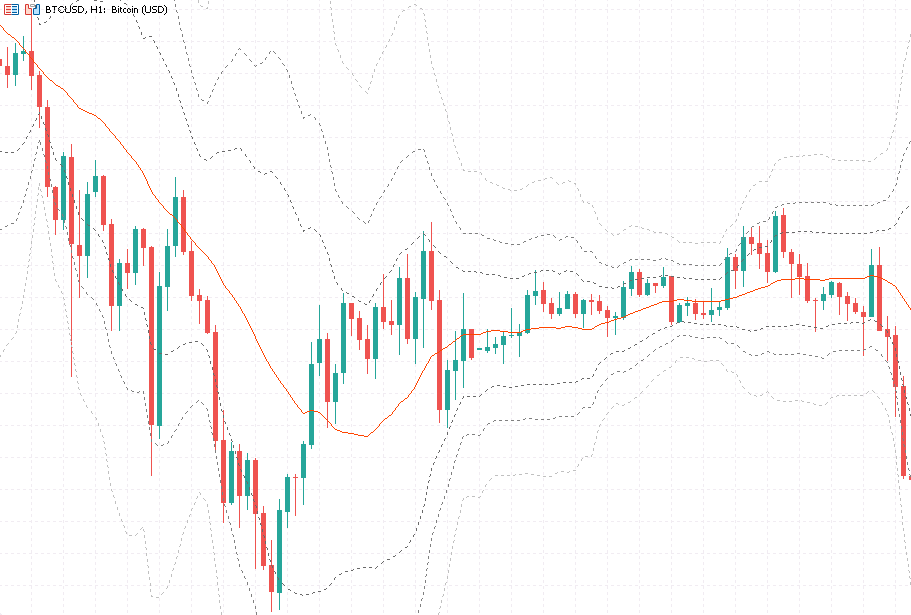
- Swing boundaries plus Fibonacci retracements and Dinapoli levels drawn right on the main chart so support and resistance read at a glance
- Projection lines spaced by the swing's own timing, marking time windows for a potential turn
Need Custom Features?
Extend this EA with custom functionality or strategy adjustments